Survivorship Curves
For
me, a life table isn't the easiest thing to read. In fact, I'd rather see all
that survival data as a graph—that is, as a survivorship curve.
A
survivorship curve shows what fraction of a starting group is still alive at
each successive age. For example, the survivorship curve for Dall mountain
sheep is shown below:
The graph makes it nice and clear that there's a small
dip in sheep survival early on, but most of the sheep die relatively late in
life.
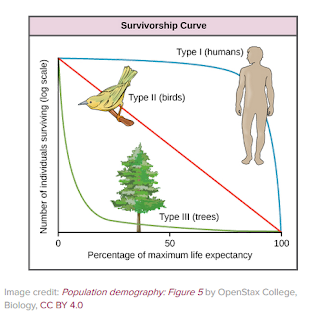
Different species have differently shaped survivorship
curves. In general, we can divide survivorship curves into three types based on
their shapes:
- Type I. Humans and most primates have a Type I survivorship curve. In a Type I curve, organisms tend not to die when they are young or middle-aged but, instead, die when they become elderly. Species with Type I curves usually have small numbers of offspring and provide lots of parental care to make sure those offspring survive.
- Type II. Many bird species have a Type II survivorship curve. In a Type II curve, organisms die more or less equally at each age interval. Organisms with this type of survivorship curve may also have relatively few offspring and provide significant parental care.
- Type III. Trees, marine invertebrates, and most fish have a Type III survivorship curve. In a Type III curve, very few organisms survive their younger years. However, the lucky ones that make it through youth are likely to have pretty long lives after that. Species with this type of curve usually have lots of offspring at once—such as a tree releasing thousands of seeds—but don't provide much care for the offspring.


Is there any relation between the complexity in organism with the type of survivorship curve?
BalasHapusbagaimana cara menerapkan konsep ini dalam dunia ekologi?
BalasHapus