POIN CENTERED QUARTER
PAPERS
Prepared to
conform the task subject ecology
Lecture by Dr.
Hadi Suwono, M.Si and Dr. Vivi Novianti, S.Si, M.Si
Group 6
Dita Perdana (150341607509)
Dwi Darmayanti (150341601390)
Moch. Fahrur Rozi (150341601364)
Ridadyah Wilujeng (150341600127)
UNIVERSITAS
NEGERI MALANG
FACULTY OF MATH
AND SCIENCE
BIOLOGY MAJORS
March 2017
CHAPTER I
PREFACE
1.1
Background
On this earth, in a
landscape of certain types of plants have a tendency to form a community of
plants, people plant which is called the vegetation is basically formed as a
result of two important phenomena, ie the difference in tolerance to the
environment and their heterogeneity of the environment.
According Kimbal (1965:
91) analysis is a way of studying the arrangement of vegetation (species
composition) and form (structure) of vegetation or plant communities. For a
comprehensive forest conditions, the vegetation analysis activities closely
related to sampling, which means that we can simply put some sample plots to
represent the habitat. In this sampling, there are three things to note, that
the number of sample plots, how the laying of sample plots and vegetation
analysis techniques were used.
Methods point centered quarter (PCQ) is a
method that is widely used for a range of trees and shrubs. The parameters used
are the frequency, density and dominance. The number of individuals in an area
can be determined by measuring the distance between the individual plants with
the sampling point. Sampling point is the point in the transect line, at that
point divided into four quadrants, each individual plant closest distance to the
sampling point.
methods point centered quarter (PCQ) is one of the methods without plot. The
advantage of using the method without the plot than the standard plot-based
techniques is that the method of point
centered quarter (PCQ) tend to be more efficient. Without plot method is
faster to perform, requiring relatively little equipment, so it requires little
labor (Mitchell, 2007).
1.2
Purpose
1.
Knowing the type of plant life Malabar forest
Malang
2.
Knowing the Importance Value Index (IVI)
each plant species in a vegetation using the point centered quarter in Malabar Forest
3.
Knowing the influence of abiotic factors
on the dominance of plants in Malabar Forest
1.3 Benefit
1.
Know type of plant at Malabar forest
2.
Know the the Importance
Value Index (IVI) plant at Malabar Forest
3.
Know relation about abiotic factor with dominance
plant
1.4 Limited
The study was conducted
in a forested area Malabar city on Thursday, March 8, 2017. The tree that can
be analyzed by PCQ only method that has a circumference of at least 30 cm. Data
taken for PCQ method only quadran 1, 2, and 4.
1.5 Operational
Definition
1.5.1
Vegetation
Vegetation is a collection of some plants, usually consisting of
several types and living together in one place. Among these individuals there
is a close interaction between the plant itself and the animals that live in
the vegetation and-facto environmental factors (Fakuara, 1990).
1.5.2
Analysis Vegetation
vegetation analysis is a way of description of a type of
vegetation based on the floristic composition of vegetation is to make a list
of the type of a community (Martono, 2012).
1.5.3
PCQ(PointCenteredQuarter)
PCQ(PointCenteredQuarter)is one method of
distance(DistanceMethod).This method does not use sample plot (plotless) and
generally used in the analysis stage vegetation tree or pole(pole).
1.5.4
Absolute
Density
AbsoluteDensity is defined as the number of trees per unit
area (Mitchell, 2007).
1.5.5
Relative
density
relative density of each species is defined as a percentage
of the total number of observations of the species (Mitchell, 2007).
1.5.6
The absolute
dominance
the absolute dominance of each species were expressed as
the area per hectare basalt (Mitchell, 2007).
1.5.7
Relative
Dominance
relative dominance of certain species is defined to be an
absolute dominance of each species divided by total closure of 100 times to
express the result in percentage (Mitchell, 2007).
1.5.8
The Importance
Value Index
important value is the price that is obtained based on the
sum of the relative value of a number of variables that have been measured
1.5.9
Frequency
Frequency is a variable which describes the propagation of
the population in a region (Syafei, 1990)
CHAPTER II
LITERATURE
2.1
Definition of Vegetation
Vegetation is a
collection of herbs, usually consist of some kind of living together in one
place. In the mechanisms of life together are close interactions, both amongst
individuals vegetation component itself and with other organisms making a
living system and growing and dynamic (Fakuara, 1990).
Vegetation, soil and
climate are closely linked and in every place has a specific balance.
Vegetation somewhere will vary with vegetation elsewhere because of its
different environmental factors. The forest vegetation is something dynamic
system, always evolving in accordance with the state of the habitat.
Tjitrosoepomo (2004),
stated that the analysis of plant communities is a way of studying the
arrangement or composition or structure of the type and form of vegetation. In
forest ecology, vegetation units are studied or investigated in the form of
plant community is a concrete association of all the species of plants that
occupy a habitat. Therefore, the objectives to be achieved in a community
analysis is to determine the species composition and community structure in an
area being studied.
2.2 Definition of
Point Center Quarter Method
Point center quarter
method is a method to use to distance many trees and shrubs. The parameters
used are the frequency, density and dominance. The number of individuals in an
area can be determined by the density and dominance. The number of individuals
in an area dpat determined by measuring the distance of individual plants with
the sampling point. Sampling point is the point in the transect line, at that
point divided by four quadrants, each of which contained individual plants
closest distance to the sampling point.
Quadrant method or
"Point-Centered Quarter Method" is one method of distance (Distance
Method). This method does not use sample plot (plotless) and generally used in
the analysis stage vegetation tree or pole (pole). But can also be equipped
with saplings (mutual or belta) and seedlings (seedling) if you want to observe
the vegetation structure tree. Trees are plants ³ 20 cm in diameter, the
diameter of 10-20 cm is piling, diameter <10 cm and height of trees> 2.5
m is the stake, as well as tree height <2.5 m is tillers. Terms
implementation quadrant method is the distribution of tree or pole to be
analyzed must be random and not clumped or uniform.

A variety of characters
plants can be measured, usually vegetation parameters commonly measured is the
density (density), dominance, and frequency (frequency), Importance Value Index
(IVI). Density, dominant, frequency, and INP can be obtained by various means
sampling method. Parameters such vegetation can be quantified as follows:
1.
Density
Density (density) is a count of the number
of individuals of a species per unit area. The
Size in square meters (m2).
The density of all species = count number of individuals of all species
The
area snippet
Above calculation is the
calculation of absolute density or also called the actual density. For specific
purposes would be very useful if the contribution of individuals of one species
count is expressed as a relationship between a count of individuals of a
species with a total count of individuals of all species to be found in all the
plots studied. This is referred to as the relative density.
The relative density of
species A = Total count of the individual species A x 100%
total number of individuals of all species count
2.
Frequency
Frequency is the measurement of the distribution or
Shareable species found on the plots studied. Frequency answer questions on any
plot of these species are found or how many times the appearance of a species
on the plots studied. Frequency is expressed as a percentage of the emergence
of a plot count a species found.
Frequency of species A =
Number of plots presence of species Ax 100%
Total number of plots sampled
Frequency can be expressed in fractions or in percent.
Frequency can also be expressed by a relative term.
The relative frequency
of species A =Total frequency of species Ax 100%
The total number of frequencies across species
3. Dominance
Dominance of a species can be determined by measuring
the basal area of trees or cover(coverage)tree or herb. Broad basal area
of a species can be obtained from the tree diameter at 1.5 m from ground level.
When the tree has a root buttresses the tree diameter is measured directly
above banirnya. Cover the tree or herb is widely projected canopy or canopy of
trees or herbs. Determination is almost similar to the determination of
density, unit is cm2or m2.
4. Importance Value
Index (IVI)
Represents the sum of the relative value of the
frequency of density and dominance of a kind. INP is often used because it allows
the interpretation of the results of the analysis of vegetation.
CHAPTER III
METHOD
1.1 Time and Place of Practicum
Practical of
vegetation analysis held on Thursday, 8 March 2017 at 07.00 am until 10.30 am
at the Malabar forest Malang
1.2 Tools and Materials
1.2.1
Tools
1.
Meterroll
2.
Meter of fabric
3.
Clinometer
4.
Compass crosshairs
5.
Stationery
6.
Raffia
7.
Camera
8.
Termohigrometer
9.
SoilTermo
10.
Soil analyzer
1.2.2
Materials
1.
Plastic bag
2.
Paper label
1.3 Working Procedures
1. Specifies the observation form complex vegetation.
2. Determine the center point of observation.
3. Preparing clinometer and roll meter.
4. Make quadrant with 5x5 m, a total of 3 plots without the distance between
the plot
5. For a tree that has a circumference of at least 30 cm and located closest
to the center point of the transect made earlier in all four quadrants.
6. Measure the circumference of the tree which is parallel to the observer's
chest using a roll meter
7. Measure the height of the observer's eyes to toe
8. Measure the distance from the center of the tree.
9. Measure the distance observer of the tree.
10. Determine the elevation angle by using a clinometer.
11. Measuring abiotic factors of each plot.
12. Calculated variables: the relative density, relative dominance, relative
frequency, an important value.
CHAPTER IV
DATA ANALYSIS
4.1
Result of Data Analysis
|
Species
|
Relative
Density (%)
|
Relative
Frequence (%)
|
Relative
Dominance(%)
|
Importance
Value Index (%)
|
Rank
|
|
Albizia chinensis
|
28,571027
|
28,571428
|
13,579569
|
70,722024
|
1
|
|
Mimusops elengi
|
28,571027
|
28,571428
|
8,614340
|
65,756795
|
3
|
|
14,285689
|
14,285714
|
11,295581
|
39,866984
|
5
|
|
|
Inocarpus fagifer
|
14,285689
|
14,285714
|
39,899654
|
68,471057
|
2
|
|
Eugenia uniflora
|
14,285689
|
14,285714
|
26,610853
|
55,182256
|
4
|

From the analysis of vegetation using the point centered quarter
known that generate a sequence of dominant plant is
CHAPTER V
DISCUSSION
Based on the results of data
analysis known that plant species that have value most significant figures in
the forests of Malabar Malang, Albizia chinensis with the important value index by 70.72%, while the value
of plant species that have important numbers lowest in the vegetation is Polyalthia
longifolia, with important value index by 39.86%.
Albizia chinensis or commonly known as the Sengon tree has the
following classifications:
Classification
Division : Magnoliophyta
Class :
Magnoliopsida
Order :
Fabales
Family : Fabaceae
Genus : Albizia
Species : Albizia
chinensis
Common name / trademark: Sengon
Description
Habitus : Tree
can reach 40 m high with a large branch of ± 20 m.
Trunk : The
surface of the bark of white, gray-greenish abuatau, smooth, sometimes slightly
beralurdengan stripes elongate lenticels. Dimater average 70-80 cm.
Leaves :The
leaves are arranged paripinnately sengon double with small leaves children and
easy to fall off. Pale green leaf color sengon
Flowers : Flowers
are arranged in the form tanamn sengon malay size of about 0.5 to 1 cm,
yellowish white in color and slightly hairy.
Fruit : Fruit
sengon pod-shaped, flat, thin and a length of approximately 6-12 cm
Seeds : Each
pods contain 15-30 seeds. Seed shapes like small shields and if the old seeds
are blackish brown, somewhat hard, and waxy.
Roots : Stables, brown.
(Soerianegara and Lemmens 1993).
Albizia chinensis is a plant that has an index value of the
highest importance in plants obtained from observations when PCQ which amounted
to 70.72%, this means Albizia chinensis
a species that dominates, which is the species
most commonly found in every quadrant of the sampling point to the analysis by
the method of point centered quareter. Pendominansian showed that Albizia
chinensis tolerance of living is higher
than other plant species to live in areas such vegetation. This factor supports
plant Albizia chinensis to
win the competition from among species in the ecosystem in a forest area
Malabar Malang.When associated with a discovery, Albizia chinensis found
on plots 1 and 2, where the plots have an average of abiotic factors as
follows:
·
Air temperature: 27 °
C
·
Humidity of air: 72 °
C
·
Soil Fertility: Low
·
Light: 4.25
·
Moisture ground : 1
·
soil pH: 7.5
·
temperature of land:
23
Abiotic factors that make plants Albizia chinensis better
able to liveforest area of Malabar. In addition it is also supported by a
statement stating that Albizia chinensis could grow on various types of
soil, including the soil is dry, moist soil and even in soils containing salt
and acid for sufficient drainage (Soerianegara and Lemmens 1993). Albizia
chinensis will grow optimally at soil textured sandy loam or clay dusty
soil acidity around pH 6-7.Sengon including pioneer species that can grow in
primary forest, secondary lowland rain forest and mountain forests, meadows and
along the edge street near the sea. Albizia chinensis, including
tropical plants, can be grown at an altitude of 1500 asl. Optimal height for
crop development between 0-800 above sea level and an average temperature of
18-27°C (Soerianegara and Lemmens 1993).
Polyalthia longifolia
or customarily called the plant glodok has the following classifications:
Division : Magnoliophyta
Class : Magnoliopsida
Order : Magnoliales
Familia : Annonaceae
Genus : Polyalthia
Species : Polyalthia
longifolia
Polyalthia longifolia is a plant that has the index value matters the most is
low compared to plant other types PCQ observation time which is equal to
39.86%, this indicates that the plant is very rarely found at each sampling
point. When associated with a discovery, Polyalthia longifolia is
found only on plot 5, where these plots have an average factor abiotic as
follows:
·
Air temperature: 28 °
C
·
Humidity of air: 70 °
C
·
Fertility: too little
·
light: 4
·
humidity soil: 1
·
pH : 7.5
·
soil temperature: 23.5
Judging from abiotic factor in the
plot area 5 is slightly different, it appears that the plant Polyalthia longifolia are rarely found in other
plots, this plant may actually be able to grow the area quite a lot but because
in this method only see a few quarters of plots 5 elected, so this plant is
only comparatively very little, because according Soerianegara and Lemmens (1993)
stated that Polyalthia longifolia can live in various types of soil
conditions even though it has a moisture and fertility very little. Polyalthia
longifolia is common around the pavement.
CHAPTER VI
CLOSING
4.1
Conclusion
1. Plant species that live in the forests of Malabar Malang based on analysis
of vegetation method PCQ is Albizia chinensis, Mimusops elengi, Inocarpus
fagifer, Polyalthia longifolia, and
2. Based on statistical analysis known species that has a numerical value is
important most is Albizia chinensis with Importance Value Index by
70.72% , while the plant species that have a low value of significant figures
in most of the vegetation is Polyalthia longifolia with important value
index by 39.86%.
3.
Abiotic factors affect the density,
diversity, frequency and dominance of a particular species
4.2 Suggestion
1.
It is recommended to students who do
further research to be more careful in conducting research.
2. It is advisable for students to participate in preserving the natural world
around us.
3. Suggested to the public to maintain the diversity of plants in the
environment.
4.
Advised the public to not use natural
resources particularly excessive vegetation.
REFERENCES
Fakuara, MY. 1990. Pengantar
Bioteknologi Kehutanan. Bogor: Dirjen Pendidikan Tinggi dan PAU IPB
Kimball. 1965. Biologi
Edisi kelima Jilid II . Jakarta : Erlangga.
Mitchell, Kevin. 2007. Quantitative Analysis by the
Point-Centered Quarter Method. NewYork : Hobart and William Smith Colleges.
Soerianegara,
I. and Lemmens, R.H.M.J. 1993. Plant resources of South-east Asia 5(1): timber
trees: major commercial timbers. Pudoc Scientific Publishers, Wageningen,
Netherlands.
Syafei, Eden
Surasana. 1990. Pengantar Ekologi Tumbuhan. ITB: Bandung.
Tjitrosoepomo, G. 2002. Taksonomi Tumbuhan. Yogyakarta : Gadjah
Mada University Press.
ATTACHMENT
DATA
TABEL
|
Titik Sampling
|
No. Quarter
|
Jarak (cm)
|
Nama Tumbuhan
|
Diameter Pohon (cm)
|
Keliling Pohon (cm)
|
Tinggi Pohon (cm)
|
|
1
|
1
|
-
|
-
|
-
|
-
|
-
|
|
2
|
250
|
Albizia chinensis
|
15,6050955
|
49
|
1093
|
|
|
3
|
-
|
-
|
-
|
-
|
-
|
|
|
4
|
286
|
Mimusops elengi
|
14,9681529
|
47
|
632
|
|
|
2
|
1
|
-
|
-
|
-
|
-
|
-
|
|
2
|
258
|
Albizia chinensis
|
15,9235669
|
50
|
951
|
|
|
3
|
-
|
-
|
-
|
-
|
-
|
|
|
4
|
320
|
Mimusops elengi
|
9,55414013
|
30
|
710
|
|
|
3
|
1
|
290
|
Eugenia uniflora
|
31,2101911
|
98
|
1800
|
|
2
|
-
|
-
|
-
|
-
|
-
|
|
|
3
|
-
|
-
|
-
|
-
|
-
|
|
|
4
|
-
|
-
|
-
|
-
|
-
|
|
|
4
|
1
|
350
|
Inocarpus fagifer
|
38,21650
|
120
|
1760
|
|
2
|
-
|
-
|
-
|
-
|
-
|
|
|
3
|
-
|
-
|
-
|
-
|
-
|
|
|
4
|
-
|
-
|
-
|
-
|
-
|
|
|
5
|
1
|
320
|
Polyalthia longifolia
|
20,22292
|
63,5
|
1641
|
|
2
|
-
|
-
|
-
|
-
|
-
|
|
|
3
|
-
|
-
|
-
|
-
|
-
|
|
|
4
|
-
|
-
|
-
|
-
|
-
|
Tinggi
Pengamat : 156 cm
Data
Analysis

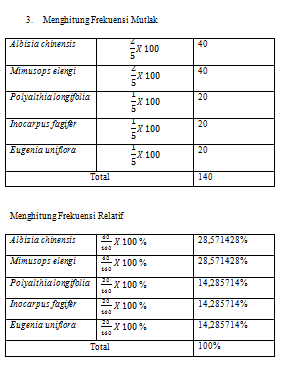
1.
Menghitung Densitas
|
Spesies
|
Jumlah
|
Jumlah
Pohon per 100 m2
|
|
Albizia chinensis
|
0,285714
|
0,000325464
|
|
Mimusops elengi
|
0,285714
|
0,000325464
|
|
Polyalthia longifolia
|
0,142857
|
0,000162734
|
|
Inocarpus fagifer
|
0,142857
|
0,000162734
|
|
Eugenia uniflora
|
0,142857
|
0,000162734
|
|
Total
|
0,00113914
|
|
Menghitung Densitas
Relatif

1.
Menghitung Dominansi
Basal Area (BA) = ¼ Πd2
|
Albizia chinensis
|
Mimusops elengi
|
Polyalthia longifolia
|
Inocarpus fagifer
|
Eugenia uniflora
|
|||||
|
D pohon
|
BA
|
D pohon
|
BA
|
D pohon
|
BA
|
D pohon
|
BA
|
D pohon
|
BA
|
|
15,60
|
191,16
|
14,96
|
175,87
|
20,33
|
324,57
|
38,21
|
1146,4
|
31,21
|
764,64
|
|
15,92
|
199,04
|
9,55
|
71,65
|
-
|
-
|
-
|
-
|
-
|
-
|
|
Total BA
|
390,20
|
|
247,53
|
|
324,57
|
|
1146,4
|
|
764,64
|
|
Rata2 BA
|
195,10
|
|
123,76
|
|
324,57
|
|
1146,4
|
|
764,64
|
Menghitung Dominansi Jenis Tumbuhan
|
Albizia chinensis
|
195,103502
X 0,000325464
|
0,0634991662
|
|
Mimusops elengi
|
123,765926
X 0,000325464
|
0,0402813533
|
|
Polyalthia longifolia
|
324,572933
X 0,000162734
|
0,0528190517
|
|
Inocarpus fagifer
|
1146,496814
X 0,000162734
|
0,1865740125
|
|
Eugenia uniflora
|
764,649682
X 0,000162734
|
0,1244345014
|
|
Total
|
0,467608085
|
|
Menghitung Dominansi Relatif

Menghitung Nilai INP
|
Species
|
Relative
Density (%)
|
Relative
Frequence (%)
|
Relative
Dominance(%)
|
Importance
Value Index (%)
|
Rank
|
|
Albizia chinensis
|
28,571027
|
28,571428
|
13,579569
|
70,722024
|
1
|
|
Mimusops elengi
|
28,571027
|
28,571428
|
8,614340
|
65,756795
|
3
|
|
14,285689
|
14,285714
|
11,295581
|
39,866984
|
5
|
|
|
Inocarpus fagifer
|
14,285689
|
14,285714
|
39,899654
|
68,471057
|
2
|
|
Eugenia uniflora
|
14,285689
|
14,285714
|
26,610853
|
55,182256
|
4
|

postingan sudah rapi dan bagus, akan tetapi biar lebih menarik pembaca, dapat ditambahkan beberapa gambar.
BalasHapuskalau mau mampir ke blog saya di http://norazeezah.blogspot.co.id/
goodjob duta pcq dwi hehe :D dari laporan ini bisa diketahui ya ternyata pohon dengan INP tertinggi adalah Albizia chinensis
BalasHapusSudah lwngkap kok
BalasHapussudah bagus, namun perbaiki penulisannya ya supaya rapi
BalasHapussudah baik, tetapi perlu diperhatikan ukuran hurufnya
BalasHapusgambarnya kecil gan, ane kagak keliatan
BalasHapus